School overview reports
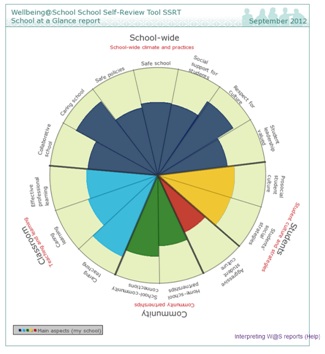
These circular reports are designed to represent each school as a system with different dimensions (aspects). The reports give a broad overview of the W@S data by aspect and sub-aspect. They can be used as a starting point to look for patterns or differences that can then be explored more fully in the more detailed report types. The Student Survey report displays national reference data for relevant year levels. The graphs below show examples of the School overview report for student data and the SSRT.
Examples of School overview reports for student data and the SSRT
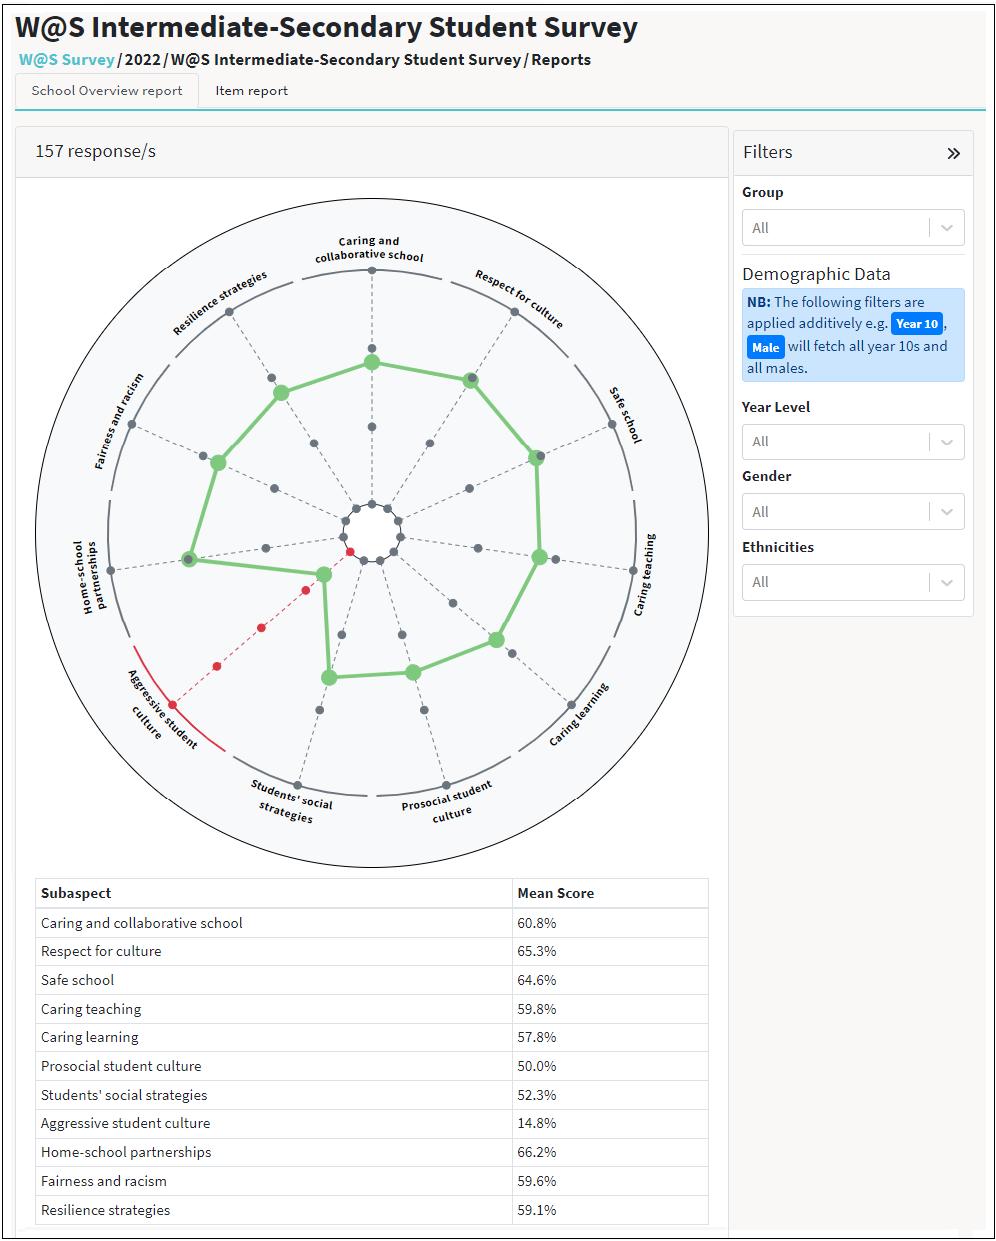
Each main aspect of W@S is represented by a different coloured sector. Main aspects are broken down into its sub-aspects where appropriate. In general, if most of the sector is coloured in, this shows that there is a high level of agreement that this aspect is in place at your school. If a sector is only coloured near the centre of the circle this shows there is a lower level of agreement that this aspect is in place.
IMPORTANT NOTE: The Aggressive student culture aspect is different from the others. A small section indicates lower levels of aggressive behaviour and a larger coloured section shows higher levels.
Interpreting the School overview reports
The circular overview reports are designed to assist you to think about which aspects you might want to explore in more detail. Broadly speaking the two reports (student and SSRT) are comparable. However, any inferences drawn from these comparisons should be regarded with caution.
The student report is based on standardised scale scores (generated by the Rasch Model, see the W@S technical manual [pdf]) and the SSRT report is based on aggregated items scores from the SSRT. While the two scales are not the same as each other they do cover the same areas of wellbeing and work in the same direction. In this sense they are comparable. Unusual, unexpected or interesting comparisons made from these reports will need further analysis of the more detailed reports before firm conclusions can be reached.
The report which summarises the SSRT has more sectors than the student report. This reflects the differences in the surveys. The student survey is shorter, and asks students about a subset of aspects of wellbeing. The SSRT survey is quite a lot longer and covers more aspects directly relevant to teaching staff.
Each sector (aspect or sub-aspect) represents an aggregated form of responses to a group of items. Within each report scales have been standardised so that mean scores on each aspect can be compared to each other.
Some examples of how you might use the summary reports
Identify possible strengths
Look at the overall patterns in both reports. Are there any aspects, or sub-aspects for which most of the sector is coloured in? If both reports show a high level, this could indicate a strength at your school.
Identify possible next steps or areas to build practice in
Look at the overall patterns in both reports. Are there any aspects, or sub-aspects, for which there appears to be a lower level of agreement. If one or both reports show low levels this indicates that further exploration in the more detailed reports (box plots and strip plots) is warranted. These areas may become a focus in your action plan.
Explore the level of aggressive behaviour at your school
This is an important aspect to follow up. It is common for staff and students in a school to have quite differing views as to the frequency of such behaviours. If the Aggressive student culture sector and the Prosocial student culture and strategies sectors are approaching each other in size (indicating lower levels of prosocial behaviour, and higher levels of aggressive behaviour), further exploration of the box plot and strip plots should be undertaken to try and identify particular problem areas or particular student groups. Even if the students at your school report less aggressive behaviour than their peers at other schools it is important not to overlook your findings. For any student that is experiencing these behaviours, this is an unacceptable experience, which has the potential to adversely affect their longer-term health and education.
Identify similarities and differences between students and staff
When comparing patterns between staff (SSRT) and students it is important to note that the two reports are built on different scales. To make the most of any comparison between staff and students, look for areas in which staff and student views appear to be differently allocated. For example, on the SSRT report staff may show a high level of agreement with the sub-aspect Caring learning compared to Caring teaching, whereas students may show that they view these aspects the other way round. This would be an indication for further questioning in the more detailed reports. On the whole the W@S SSRT and Student Survey data reports tend to show the same general pattern but there can also be some key differences between these two groups. It is important not to ignore or try to “explain away” these differences, as they can be a useful starting point for further discussion and action.