W@S scale descriptions
The W@S scale descriptions have been developed using the items from the W@S Student Survey. The ability to associate the wording of each survey item with the threshold locations on the scale for their associated response categories (strongly disagree to strongly agree) makes it possible to provide these scale descriptions.
Each of the five scales has its own description.
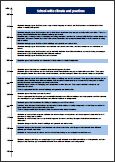
- School-wide climate and practices
- Teaching and learning
- Community partnerships
- Pro-social student culture and strategies
- Aggressive student culture.
The descriptive sentences to the right of the W@S scale describe the kinds of responses that are most probable for students whose survey scores are located at that part of the scale.
Reading the descriptions from bottom to top gives an idea of how attitudes and perceptions change as scale scores increase. In general, there is a detectable “tipping point” in the middle of the descriptions, where typical views begin to show a more positive (rather than negative) perception of school climate. For instance, in the scale description for School-wide climate and culture the tipping point happens between about 200 wbs and 250 wbs. At 200 wbs, students are likely to be disagreeing that students adhere to schools rules, or that teachers are interested in their family’s background or culture, but by 250 wbs students are typically reporting more positive pro-social behaviour amongst their peers, that teachers and students get on well, and that they feel accepted at school.
The scale descriptions should also be used in conjunction with the reports generated by the W@S website related to the different aspects (Aspects at a Glance). This report shows distributions of student scale scores by aspect, with box plots. Linking the distribution of scale scores shown by the box plots with the scale descriptions allows the survey results to be interpreted in terms of the typical responses students are making to survey questions.
 School climate and practices
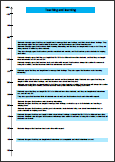 Teaching and learning
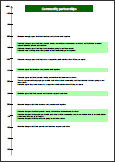 Community partnerships
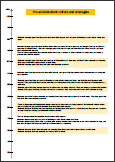 Pro-social student culture and strategies
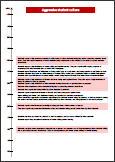 Aggressive student culture